Year 3 · Maths · Statistics · Free Printable
Reading and Creating Graphs Worksheet
Help Year 3 students read information from graphs and create simple graphs from collected data.
Worksheet Preview
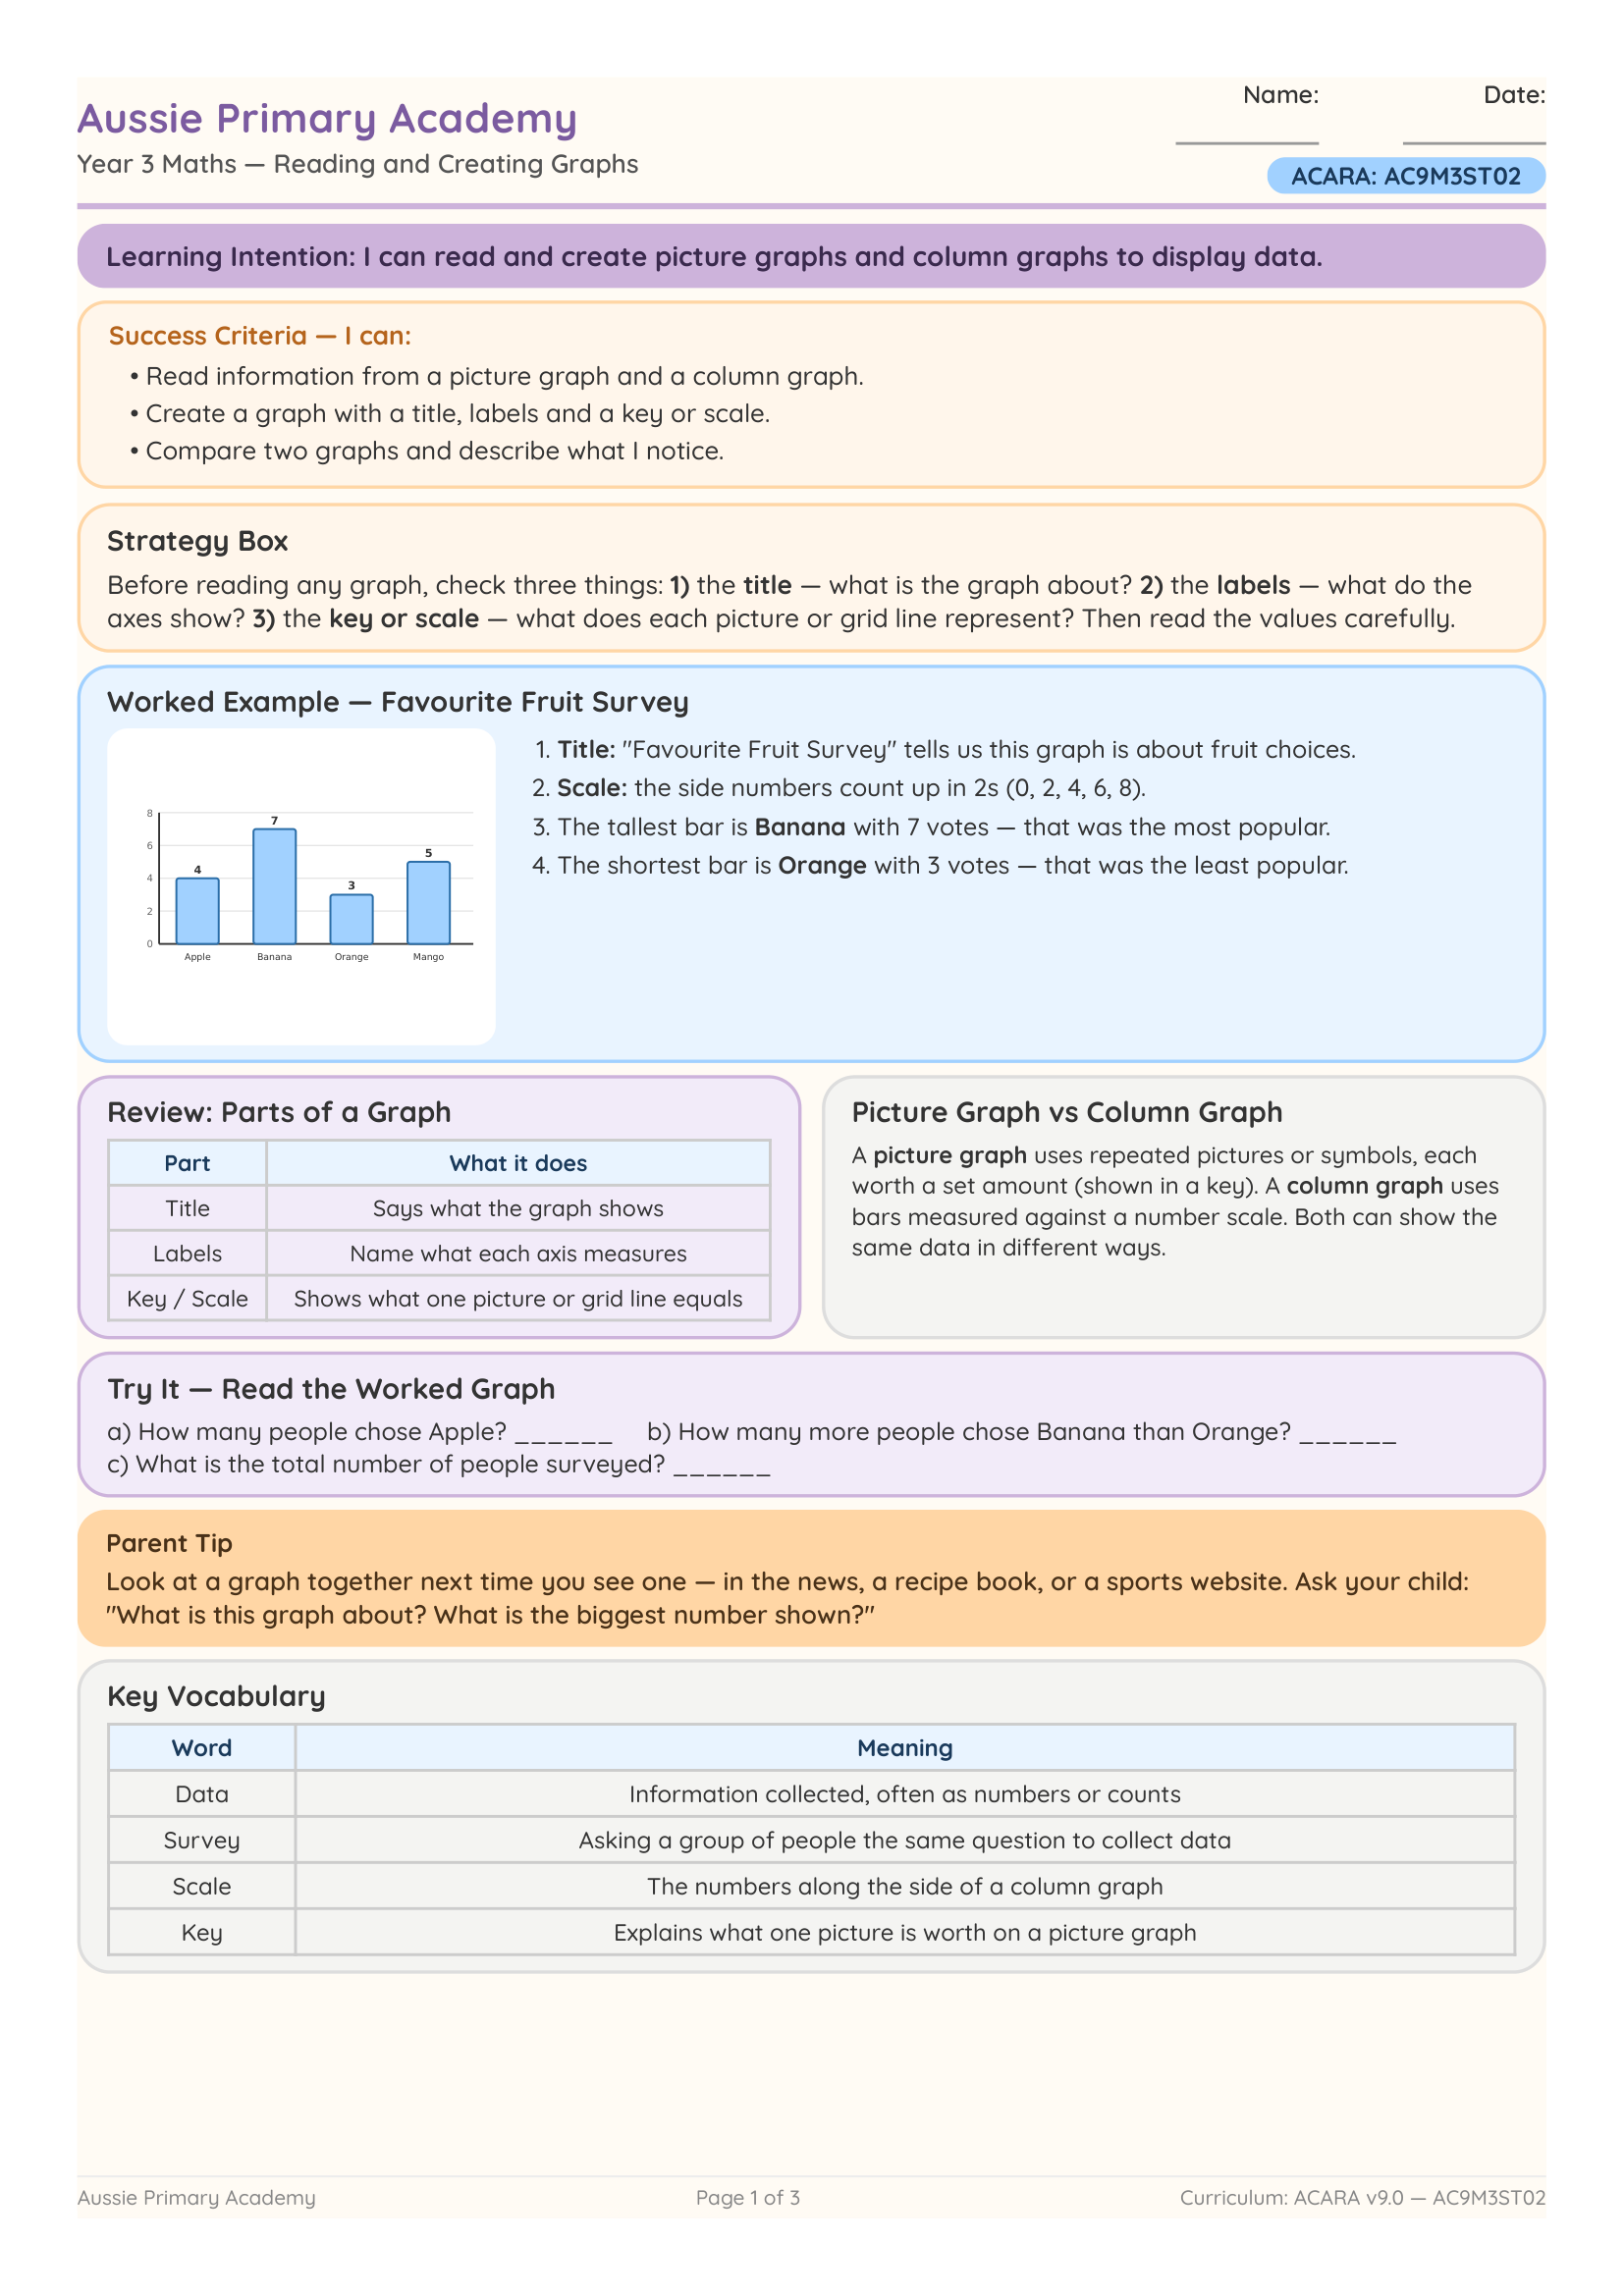
Preview of first page · Full worksheet inside the PDF
Quick Facts
- Primary learning: Maths · Statistics
- Year level: Year 3
- Focus: Reading and creating simple graphs
- Curriculum code: AC9M3ST02
- Format: Colour PDF · Printable A4
- Best for: Classroom, homework, tutoring, homeschool
About this worksheet
This Year 3 Maths worksheet helps students interpret information from graphs and create their own simple column or picture graphs. Clear activities build data literacy.
Ready to print and use for whole-class lessons, small groups, homework or home learning.
Learning Intention
Students will read information from graphs and create simple graphs from data.
Curriculum Alignment
AC9M3ST02
Create and interpret simple graphs from data, including column graphs and picture graphs.
Aussie Primary Academy is an independent publisher and is not endorsed by ACARA.
Skills Practised
- Reading graphs
- Creating column and picture graphs
- Interpreting data
- Answering questions from graphs
Teacher / Parent Notes
Start by reading a class-made graph together. Then let students create their own from a simple data set.
How to use this worksheet
- Whole class: Explicit teaching + independent practice
- Small groups: Shared data collection then graphing
- Homework: Create a graph from a home survey
- Tutoring / Homeschool: Clear instructions for independent use
Differentiation
Support: Provide pre-drawn axes and picture templates.
Core: Complete all activities independently.
Extend: Compare two graphs and write three conclusions from the data.